
AeroStat Giovanni Quick Start
AeroStat Data Products
Original Level 2 Measurements
AERONET
MODIS
MISR
AeroStat Derived Products
Satellite Colocated with AERONET
Satellite Only
AeroStat Giovanni Services
Satellite Colocated with AERONET
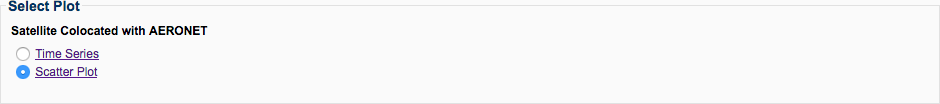
Time Series
Scatter Plot (Match in Time, Add'l filtering)
Satellite Only
Lat-Lon Map
Gridded Daily Map
Merged_Level_2_Map
Filters
No. of Pixels
QA
Bias Adjustment
FAQ
AeroStat is an online environment for the direct statistical intercomparison of global aerosol parameters, in which the provenance (data lineage) and data quality can be easily accessed. The support for this online platform of the statistical intercomparison of aerosols is through the ROSES 2009 ACCESS Program (PI: Gregory Leptoukh).
A more interactive access to the sampled data is provided by the WEB-based data customization and plotting interface, https://giovanni.gsfc.nasa.gov/mapss/. Using this interface, it is possible to create a custom file containing one or more datasets of interest, sampled at a specific location and at a specific time duration. It is also possible to display the selected data on a plot, providing for a rapid data exploration and evaluation process.
The following is a sequence of steps that users should follow:
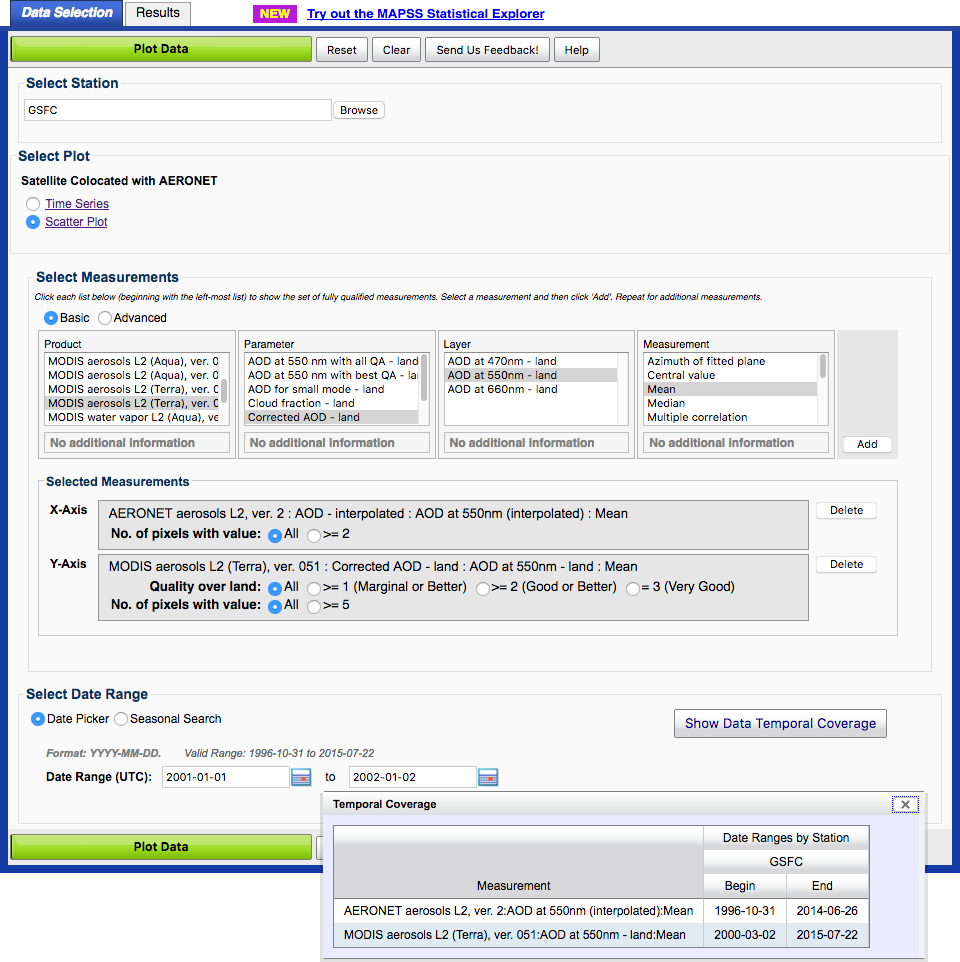
Step 1: Select Service:
We use "Scatter Plot" as an example for this example.
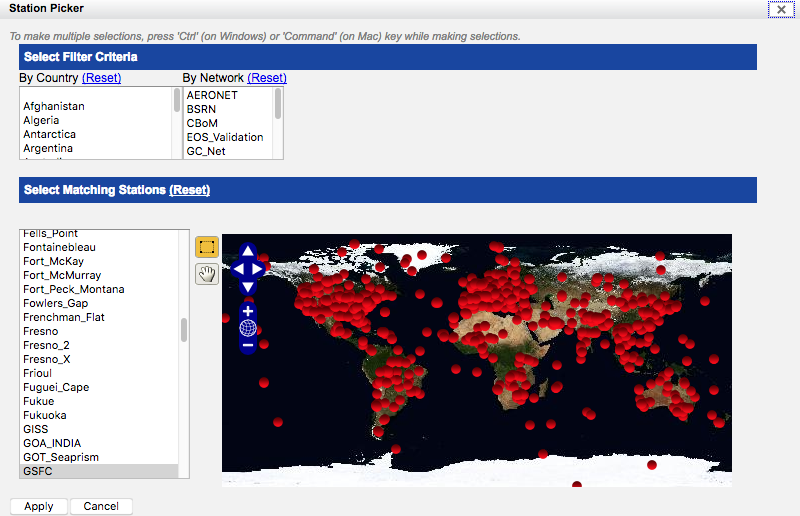
Step 2: Select one ground location (AERONET station)
Tip: location can be entered either manually by typing in location name, or by using the location selection dialog that opens by clicking on the "Select" button.
NOTE: Location name is case sensitive.

If click "Browse", then a new window pops up as below.
Step 3: Select one or more parameters
Tip: Hovering with a mouse pointer over items in the Product, Parameter, Layer, and Measurement would produce a pop-up with a more complete description of the item. NOTE: Need to select all the items, then Add button will show. Need to click Add to complete the selection.
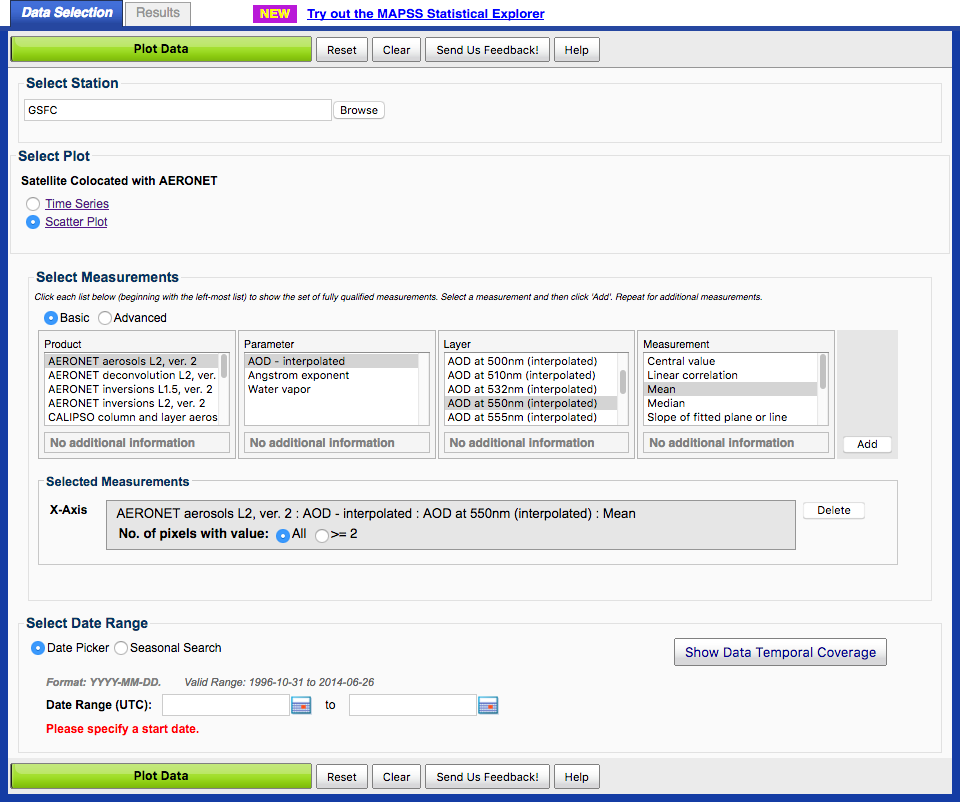
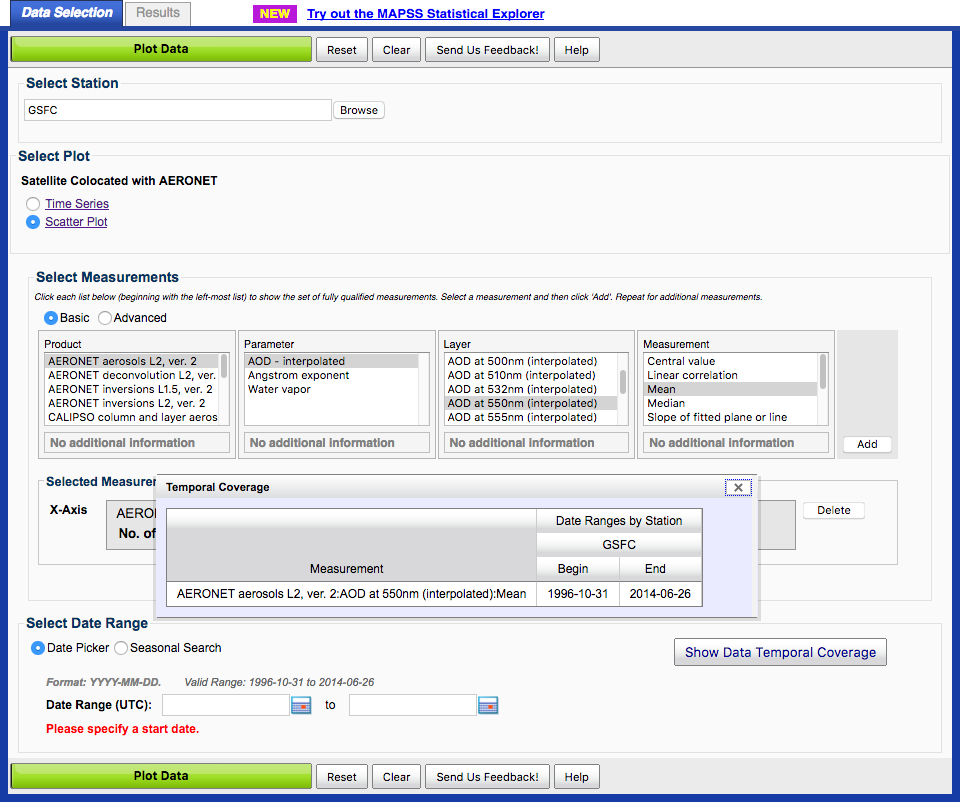
Step 4: Select dates range
Tip1: Temporal coverage for the selected measurement can be seen by clicking Show Data Temporal Coverage.
Tip2: dates can be either typed in manually using the mm/dd/yyyy format, or by using the calendar dialog that opens by clicking on the calendar icons next to the date range fields.
Step 5: Click "Get Plot(s)" and stand by while data are retrieved
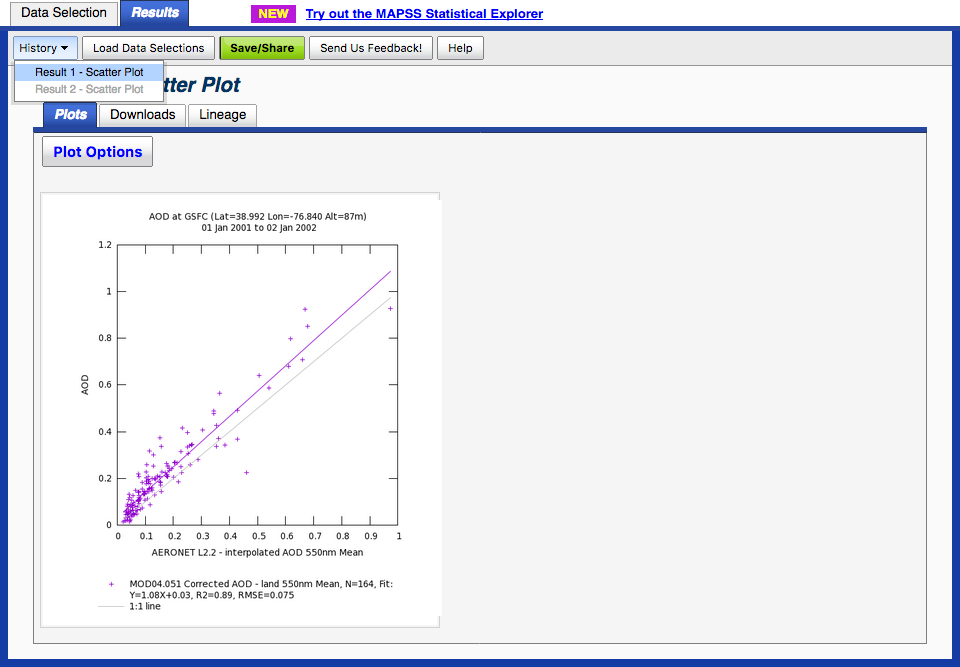
Step 6: Data are displayed on one or more plots
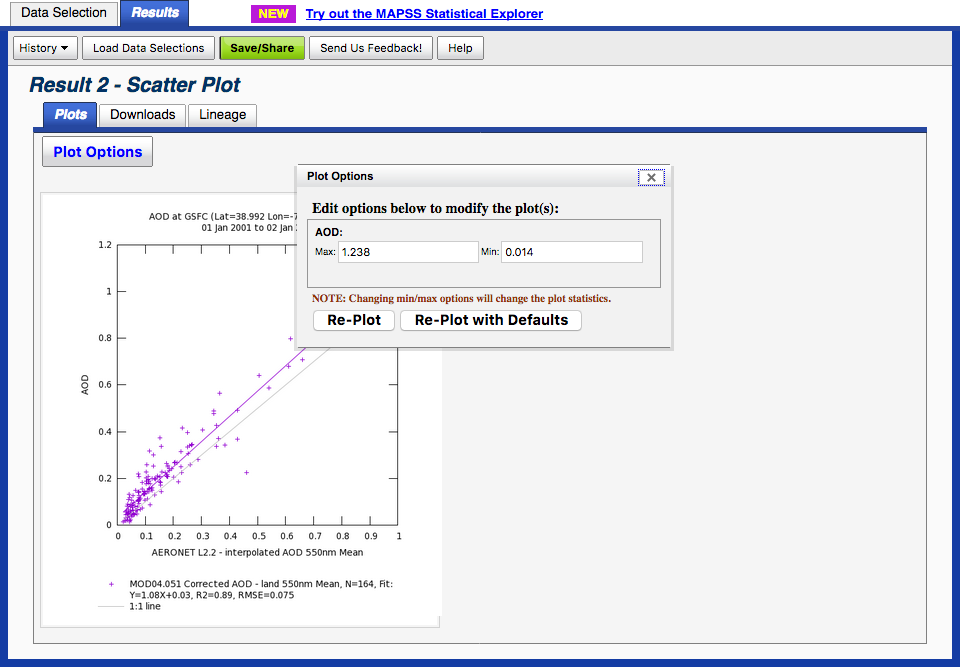
NOTE: There is "Plot Option" for Scatter Plot service only. User can change the range in X-Axis or/and Y-Axis and click the replot.
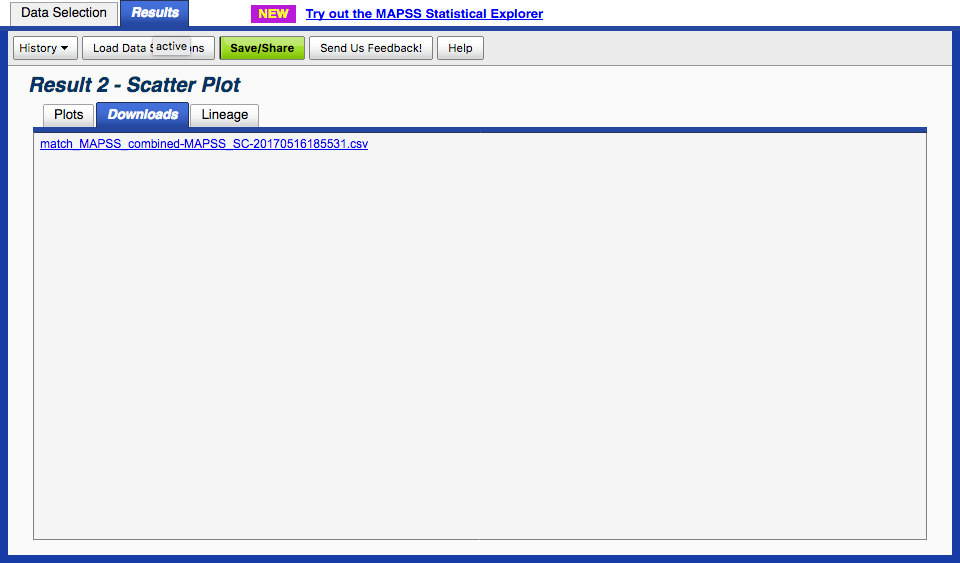
Step 7: Retrieved data can be downloaded as an CSV file
Step 8: Data linage tab provides a summary of the retrieved data
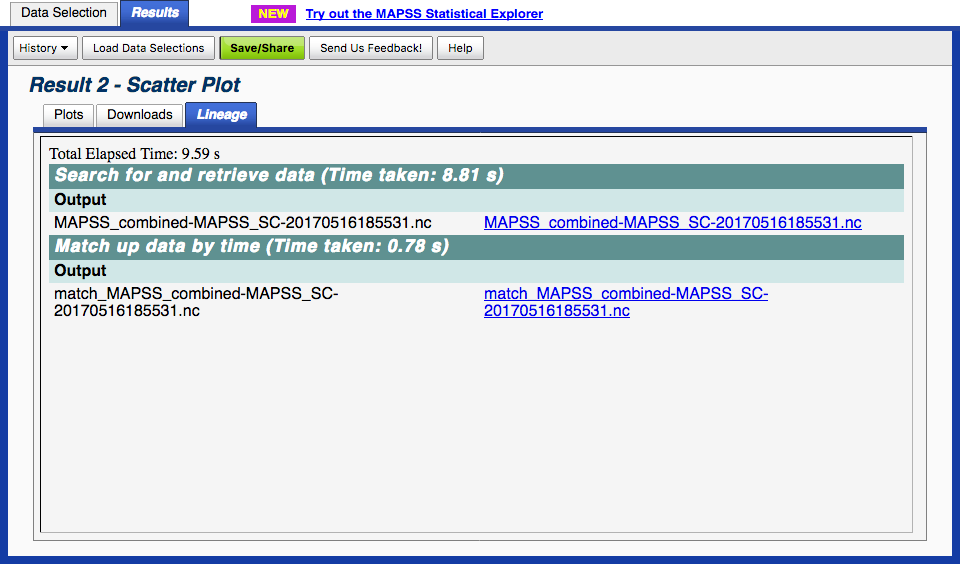
Step 9: Previous results and their data selection criteria can be reloaded if necessary
Tip: "Load" button reloads only the results of past trials. To also reload data selection criteria that were used to produce these results, please press "View Criteria"; until this button is pressed, the "Data Selection" tab will show the data selection criteria of the most recent results.
NOTE:
1. Do not click on the Go Back One Page  button, otherwise all the selection will disappear.
2. Click Problem? Send a report, if encounter any error.

The data produced in AeroStat Giovanni are directly derived from original Level 2 measurements (AERONET, MODIS, and MISR) . There are two types of derived products in AeroStat Giovanni: Satellite Colocated with AERONET, and Satellite Only.
Table: List of original Level 2 measurements used in AeroStat.
|
Product |
Version |
From |
To |
Notes |
|
AERONET
|
||||
|
AERONET AOD L2 |
2 |
10/30/1996 |
Present |
The initial date of the availability reflects the first date it was possible to colocate observations from this product with observations from one of the spaceborne sensor products. Dates of availability vary with the stations. |
|
MODIS
|
||||
|
MODIS MOD04 L2 |
5.1 |
02/24/2000 |
Present |
The product are reprocessed by the MODIS team. |
|
MODIS MYD04 L2 |
5.1 |
07/04/2002 |
Present |
The product are reprocessed by the MODIS team. |
|
MISR
|
||||
|
MISR MIL2ASAE L2 |
22 |
02/24/2000 |
Present |
This product is usually delayed for several month in respect to a current date |
The AERONET (AErosol RObotic NETwork) program is a federation of ground-based remote sensing aerosol networks established by NASA and PHOTONS (Univ. of Lille 1, CNES, and CNRS-INSU), and is greatly expanded by collaborators from national agencies, institutes, universities, individual scientists, and partners. The program provides a long-term, continuous and readily accessible public domain database of aerosol optical, microphysical and radiative properties for aerosol research and characterization, validation of satellite retrievals, and synergism with other databases. The network imposes standardization of instruments, calibration, processing and distribution. Currently, we support AERONET AOD data at processing Level 2 (cloud-screened, re-calibrated and quality assured data).
In AeroStat, we use AERONET AOD data at processing Level 2 (cloud-screened, re-calibrated and quality assured data). The following table is showing the variable names on AeroStat Giovanni and their corresponding original Level 2 Scientific Data Set (SDS).
| Giovanni Product | Giovanni Parameter | Original L2 Scientific Data Set (SDS) |
| AERONET L2 AOD, ver.2 |
AOD | Aerosol Optical Depth |
| Interpolated AOD | Interpolation of Aerosol Optical Depth |
MODIS (or Moderate Resolution Imaging Spectroradiometer) is a key instrument aboard the Terra (EOS AM) and Aqua (EOS PM) satellites. Terra's orbit around the Earth is timed so that it passes from north to south across the equator in the morning, while Aqua passes south to north over the equator in the afternoon. Terra MODIS and Aqua MODIS view the entire Earth's surface every 1 to 2 days, acquiring data in 36 spectral bands, or groups of wavelengths (see MODIS Technical Specifications).
Depending on the satellite, MODIS products have a MODXX (Terra) or MYDXX (Aqua) designation, where XX is a two-digit number identifying a product. In AeroStat, we use MOD04_L2 and MYD04_L2 products from MODIS instrument.
MOD04 and MYD04 are aerosol products produced by the MODIS instrument on board the Terra (MOD) and Aqua (MYD) satellites. The MODIS Aerosol Product monitors the ambient aerosol optical thickness over the oceans globally, and over a portion of the continents.
Datasets in this product are split into two groups - the standard data sets (Dark Target Land and Dark Target Ocean) and Deep Blue data sets. Deep Blue data is computed over bright land surfaces (e.g., deserts), where the standard algorithm is not applicable.
Notes:
Since land and ocean retrievals use different sets of wavelengths, land-only and ocean-only data sets are usually more preferable than the merged land_and_ocean products especially when considering Quality Assurance (QA) flags.
The following table is showing the variable names on AeroStat Giovanni and their corresponding original Level 2 Scientific Data Set (SDS).
| Giovanni Product | Giovanni Parameter | Original L2 Scientific Data Set (SDS) |
| MODIS Terra L2 AOD, ver. 051 | AOD Dark Target Land | Corrected_Optical_Depth_Land |
| AOD Dark Target Ocean | Effective_Optical_Depth_Average_Ocean | |
| AOD Deep Blue at 550 nm | Deep_Blue_Aerosol_Optical_Depth_550_Land | |
| AOD Deep Blue | Deep_Blue_Aerosol_Optical_Depth_Land | |
| MODIS Aqua L2 AOD, ver. 051 | AOD Dark Target Land | Corrected_Optical_Depth_Land |
| AOD Dark Target Ocean | Effective_Optical_Depth_Average_Ocean | |
| AOD Deep Blue at 550 nm | Deep_Blue_Aerosol_Optical_Depth_550_Land | |
| AOD Deep Blue | Deep_Blue_Aerosol_Optical_Depth_Land |
The Multi-angle Imaging SpectroRadiometer (MISR) is an instrument aboard NASA's Terra spacecraft. One of the most distinct features of MISR is its ability to view the sunlit Earth from 9 widely spaced angles, which allows MISR to measure a number of aerosol properties that are not available from the other instruments. For this reason, many of the MISR data sets are provided separately for each of the 9 cameras. On the other hand, some of the data sets are a merged product of all or some of the 9 cameras. In AeroStat, we use MIL2ASAE products from MISR instrument.
MIL2ASAE is a MISR Level 2 aerosol product. It is considered to be a "FINAL" product, meaning that it is more reliable than a "FIRSTLOOK" MIL2ASAF aerosol product, but with a penalty of not being available until several months after the data were acquired.
Notes:
Each pixel in MIL2ASAE product corresponds to a 17.6km x 17.6km area. In MIL2ASAE products, this area is referred to as a "region".
The following table is showing the variable names on AeroStat Giovanni and their corresponding original Level 2 Scientific Data Set (SDS).
| Giovanni Product | Giovanni Parameter | Original L2 Scientific Data Set (SDS) |
| MISR L2 AOD, ver. 0022 | AOD | RegBestEstimateSpectralOptDepth |
The statistical terminology used in AeroStat Giovanni is described below.
|
cval |
Satellite Colocated with AERONET: Data value in the center of the subset (closest point to the measurement) |
|
nval |
Satellite Colocated with AERONET: Number of valid subsetting points in the subset |
| median | Satellite Colocated with AERONET: Statistical median of the data that are colocated with ground measurement within 27.5 km and ± 30 minutes |
|
mean |
Satellite Colocated with AERONET: Arithmetic mean of the data that are colocated with ground measurement within 27.5 km and ± 30 minutes Satellite Only: Arithmetic mean of Level 2 pixels falling within a map grid cell. |
|
QA |
Satellite Colocated with AERONET: Statistical mode of the subset with QA flags from original Level 2 Satellite Only: Quality Assurance (QA) flags from original Level 2 |
In AeroStat, we use MAPSS database for generating "Time Series" and "Scatter Plot" analysis. The process of generating the spatio-temporal statistics in MAPSS for each spatial spaceborne aerosol product involves extracting values of the pixels that fall within an approximate radius of 27.5 km from the chosen ground locations (see the diagram below). Similarly, statistics for ground-based temporal observations in a particular location are derived from measurements taken within 30 minutes of each satellite overpass (MODIS Terra, MODIS Aqua, MISR, POLDER, OMI and CALIOP) over this location*. The details of how MAPSS statistics is generated can be found at MAPSS.
*Ground-based station sampling issue: The ground-base measurements are temporal and spatial averaged data according to each satellite overpass (in this case, we have 6 different overpasses) every day. Therefore, the ground-based data are not the same as original AERONET level 2.
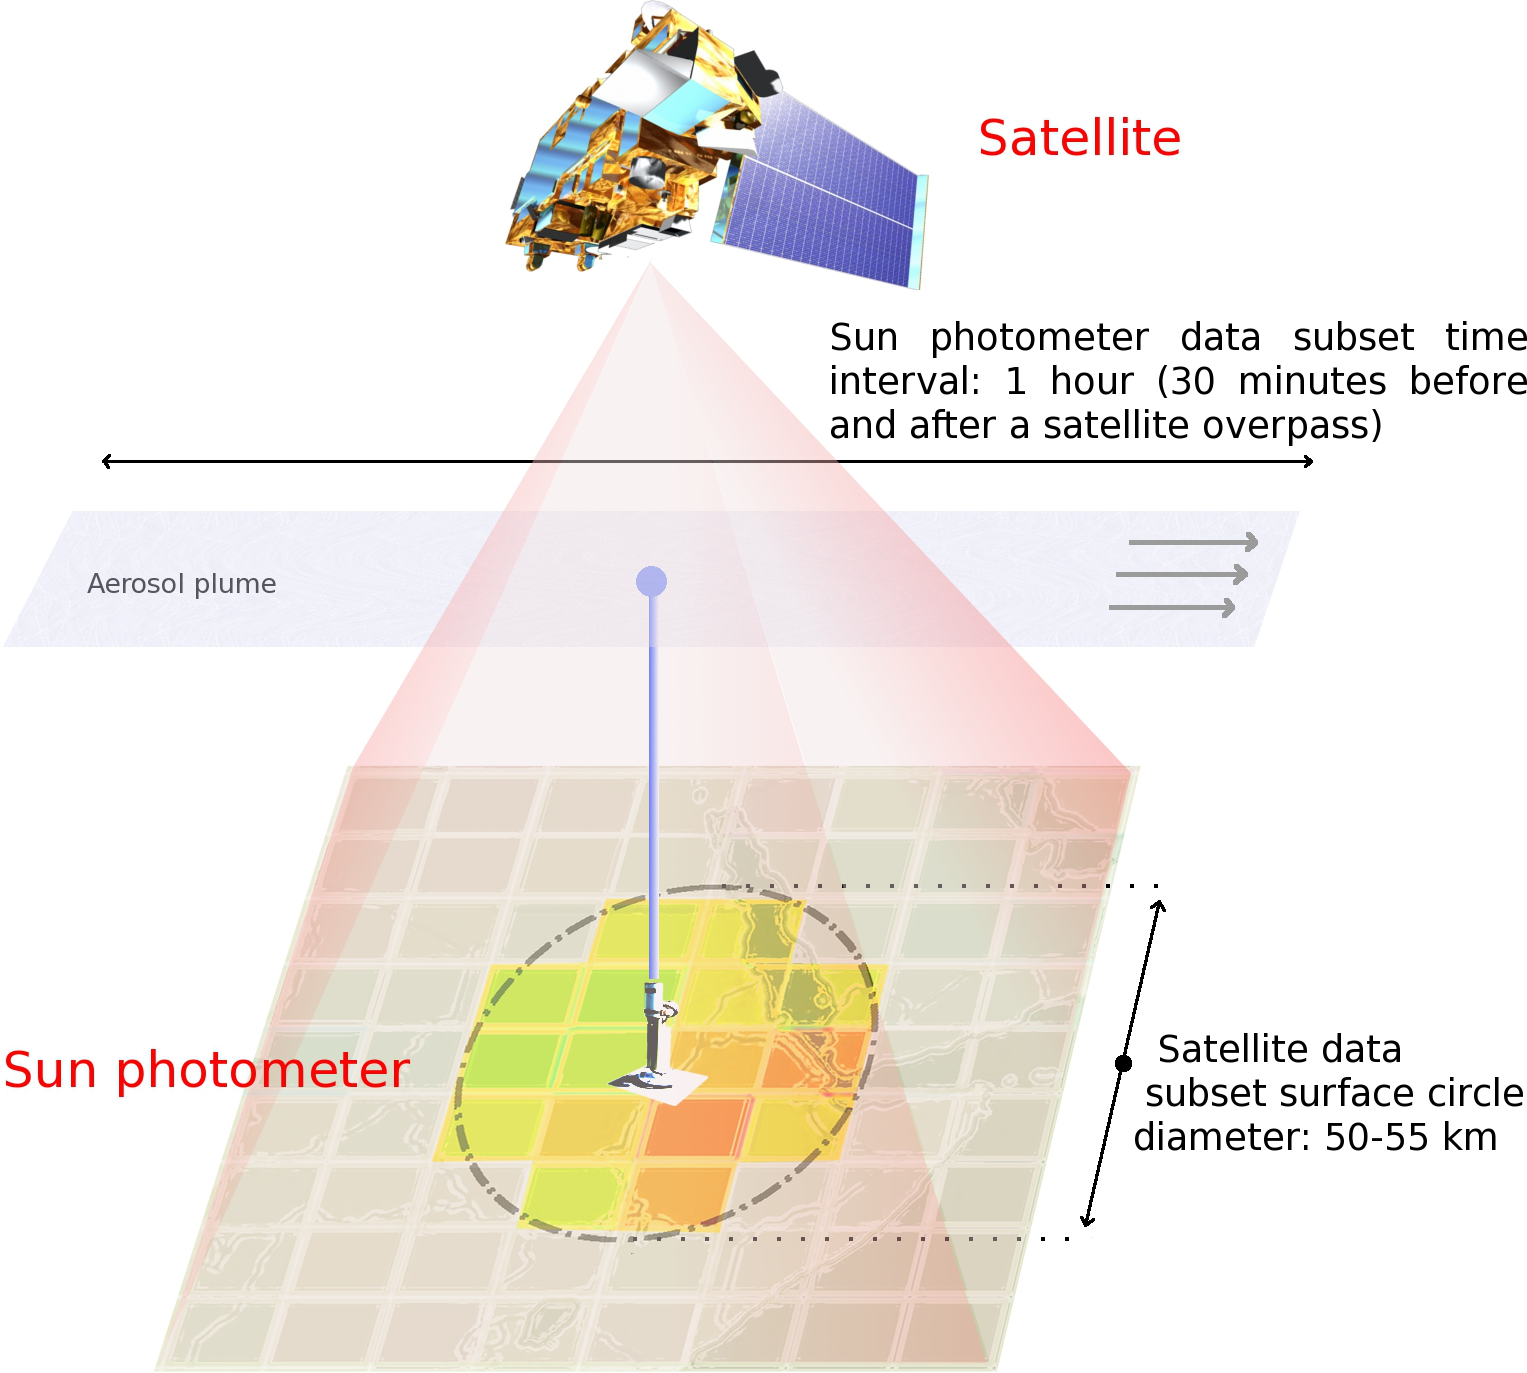
Figure : Diagram of spatial and temporal subset around ground measurement station.
For more information, please refer to the following publications:
Ichoku, C., D. A. Chu, S. Mattoo, Y. J. Kaufman, L. A. Remer, D. Tanre, I. Slutsker, and B. N. Holben, 2002: A spatio-temporal approach for global validation and analysis of MODIS aerosol products. Geophys. Res. Lett., 29, doi: 10.1029/2001GL013206. [Full Text (PDF)]
Chu, D. A., Y. J. Kaufman, C. Ichoku, L. A. Remer, D. Tanre, and B. N. Holben, 2002: Validation of MODIS aerosol optical depth retrieval over land. Geophys. Res. Lett., 29, doi: 10.1029/2001GLO13205. [Full Text (PDF)]
Remer, L. A., D. Tanre, Y. J. Kaufman, C. Ichoku, S. Mattoo, R. Levy, D. A. Chu, B. N. Holben, O. Dubovik, A. Smirnov, J. V. Martins, R.-R. Li, and Z. Ahmad, 2002: Validation of MODIS aerosol retrieval over ocean. Geophys Res. Lett., 29, doi: 10.1029/2001GL013204. [Abstract] [Full Text (PDF)]
MAPSS Products used in AeroStat
Table of AERONET Product from MAPSS
The following table is showing the variable names on AeroStat Giovanni and their corresponding original Level 2 Scientific Data Set (SDS).
Note: The available AOD wavelength (Layer) may vary based on AERONET station.
|
Giovanni Parameter/Layer |
MAPSS Data file column header |
Explanations |
Scientific Data Set (SDS) |
| AOD/1020 nm |
AOD1020 |
Aerosol optical depth at 1020nm |
AerosolOpticalDepth |
| AOD/870 nm |
AOD0870 |
Aerosol optical depth at 870nm |
AerosolOpticalDepth |
| AOD/670 nm |
AOD0670 |
Aerosol optical depth at 670nm |
AerosolOpticalDepth |
| AOD/550 nm | AOD0550 | Aerosol optical depth at 550nm | AerosolOpticalDepth |
| AOD/530 nm | AOD0530 | Aerosol optical depth at 530nm | AerosolOpticalDepth |
| AOD/500 nm | AOD0500 | Aerosol optical depth at 500nm | AerosolOpticalDepth |
| AOD/490 nm |
AOD0490 |
Aerosol optical depth at 490nm |
AerosolOpticalDepth |
| AOD/440 nm | AOD0440 | Aerosol optical depth at 440nm | AerosolOpticalDepth |
| AOD/410 nm | AOD0410 | Aerosol optical depth at 410nm | AerosolOpticalDepth |
| AOD/380 nm | AOD0380 | Aerosol optical depth at 380nm | AerosolOpticalDepth |
| AOD/340 nm | AOD0340 | Aerosol optical depth at 340nm | AerosolOpticalDepth |
| Interpolated AOD/550 nm |
AOD0550intrp |
Aerosol optical depth at 550nm (interpolated) |
AerosolOpticalDepthInterpolated* |
| Interpolated AOD/558 nm |
AOD0558intrp |
Aerosol optical depth at 558nm (interpolated) |
AerosolOpticalDepthInterpolated* |
NOTE:
1. MAPSS database has temporal and spatial averaged data from AERONET level 2 according to each satellite overpass (in this case, we have MODIS Terra, MODIS Aqua, and MISR, 3 different overpasses) every day. Therefore, these AERONET_AOD are not the same as original AERONET level 2 AOD.
2. MAPSS includes the "AerosolOpticalDepthInterpolated" dataset that is a derived product, produced in MAPSS by interpolating the original AERONET AOD data using the quadratic fit on log-log scale (Eck et al, 1999). It is not supported by AERONET team, and designated strictly for validation purposes.
Table of MODIS Product from MAPSS
The following table is showing the variable names on AeroStat Giovanni and their corresponding original Level 2 Scientific Data Set (SDS).
|
Giovanni Parameter/Layer |
MAPSS Data file column header |
Explanations |
Scientific Data Set (SDS) |
|
AOD Dark Target Land/470 nm |
AOD0470corr-l |
Corrected aerosol optical depth at 470nm for land |
Corrected_Optical_Depth_Land |
| AOD Dark Target Land/550 nm |
AOD0550corr-l |
Corrected aerosol optical depth at 550nm for land |
Corrected_Optical_Depth_Land |
| AOD Dark Target Land/660 nm |
AOD0660corr-l |
Corrected aerosol optical depth at 660nm for land |
Corrected_Optical_Depth_Land |
| AOD Dark Target Ocean/470 nm |
AOD0470ea-o |
Effective aerosol optical depth at 470nm of average solution for ocean |
Effective_Optical_Depth_Average_Ocean |
| AOD Dark Target Ocean/550 nm |
AOD0550ea-o |
Effective aerosol optical depth at 550nm of average solution for ocean |
Effective_Optical_Depth_Average_Ocean |
| AOD Dark Target Ocean/660 nm |
AOD0660ea-o |
Effective aerosol optical depth at 660nm of average solution for ocean |
Effective_Optical_Depth_Average_Ocean |
| AOD Dark Target Ocean/870 nm |
AOD0870ea-o |
Effective aerosol optical depth at 870nm of average solution for ocean |
Effective_Optical_Depth_Average_Ocean |
| AOD Dark Target Ocean/1200 nm |
AOD1200ea-o |
Effective aerosol optical depth at 1200nm of average solution for ocean |
Effective_Optical_Depth_Average_Ocean |
| AOD Dark Target Ocean/1600 nm |
AOD1600ea-o |
Effective aerosol optical depth at 1600nm of average solution for ocean |
Effective_Optical_Depth_Average_Ocean |
| AOD Dark Target Ocean/2100 nm |
AOD2100ea-o |
Effective aerosol optical depth at 2100nm of average solution for ocean |
Effective_Optical_Depth_Average_Ocean |
| AOD Deep Blue at 550 nm/550 nm |
AOD0550dpbl-l |
Deep Blue aerosol optical depth at 550nm (corrected) with all quality data (Quality flag=1,2,3) for land |
Deep_Blue_Aerosol_Optical_Depth_550_Land |
| AOD Deep Blue/412 nm |
AOD0412dpbl-l |
Deep Blue aerosol optical depth at 412nm (corrected) with all quality data (Quality flag=1,2,3) for land |
Deep_Blue_Aerosol_Optical_Depth_Land |
| AOD Deep Blue/470 nm |
AOD0470dpbl-l |
Deep Blue aerosol optical depth at 470nm (corrected) with all quality data (Quality flag=1,2,3) for land |
Deep_Blue_Aerosol_Optical_Depth_Land |
| AOD Deep Blue/660 nm |
AOD0660dpbl-l |
Deep Blue aerosol optical depth at 660nm (corrected) with all quality data (Quality flag=1,2,3) for land |
Deep_Blue_Aerosol_Optical_Depth_Land |
NOTE:
1. Datasets in this product are split into two groups - the standard data sets and Deep Blue data sets. Deep Blue data is computed over bright land surfaces (e.g., deserts), where the standard algorithm is not applicable.
2. Since land and ocean retrievals use different sets of wavelengths, land-only and ocean-only data sets are usually more preferable and contain more data than merged land-ocean data sets.
Table of MISR Product from MAPSS
The following table is showing the variable names on AeroStat Giovanni and their corresponding original Level 2 Scientific Data Set (SDS).
|
Giovanni Parameter/Layer |
MAPSS Data file column header |
Explanations |
Scientific Data Set (SDS) |
| AOD/446 nm |
AOD0446b |
Best estimate of aerosol optical depth for the region at 446nm |
RegBestEstimateSpectralOptDepth |
| AOD/558 nm |
AOD0558b |
Best estimate of aerosol optical depth for the region at 558nm |
RegBestEstimateSpectralOptDepth |
| AOD/672 nm |
AOD0672b |
Best estimate of aerosol optical depth for the region at 672nm |
RegBestEstimateSpectralOptDepth |
| AOD/866 nm |
AOD0866b |
Best estimate of aerosol optical depth for the region at 866nm |
RegBestEstimateSpectralOptDepth |
In AeroStat Satellite Only data set, we currently use MODIS Terra, MODIS Aqua and MISR Level 2 information (described in the above "Original Level 2 Measurements") for Giovanni "Lat-Lon Map" services.
The AeroStat Giovanni currently provides "Time Series", "Scatter Plot", and "Lat-Lon Map" online visualization services, based on the type of the datasets (Satellite Colocated with AERONET, or Satellite Only). In addition, the AeroStat Giovanni provides filters service/function based on quality flags, no. of pixels, and bias adjustment options, using either criteria recommended by the science team or the users' own criteria.
The time series provides multiple variables in a selected time period from MAPSS database. The "time" used for time series is from cval_time, which represents the closest point in time to the measurement.
Note: For AERONET data: each AERONET data point has a corresponding satellite overpass, i.e., the number of AERONET points per day equals to the number of various satellite/sensor overpasses. For example, there are nominally six AERONET points in a day, which corresponds to MODIS-Terra, MISR-Terra, MODIS-Aqua, CALIOP, OMI, and Polder at a certain AERONET location. At higher latitudes, there may be more AERONET data points at a location in a day.
The scatter plot provides multiple variables (Y-Axis) corresponding to the same variable in X-Axis from MAPSS database. Since MAPSS provides coincident data around each ground station with respect to each satellite overpass, the scatter plot service finds the "matched in time" with respect to the "reference measurement". AeroStat uses ±30 minutes time interval from the reference measurement (currently available measurements are AERONET, or MISR, or MODIS Terra, or MODIS Aqua) for the selected AERONET site. However, if user wants to compare Aqua and Terra platform (say MISR vs MODIS Aqua or MODIS Terra vs MODIS Aqua), then the delta time interval is set to be ±2.5 hrs (= ± 150 minutes).
Specifically, there are only 4 possible instruments to be selected as "Reference" measurement. Once the user determines the "Reference" measurement, then the "closest pairs in time" service can be performed according to the "Reference" time stamps during the selected time period and the output will be reported according to the "Reference" time stamps. The combination of selecting "Reference" to generate the "closest pairs in time" as following:
1. AERONET is the reference
All other selected variables should have dt = ±30 minutes for the pair match.
2. MISR is the reference
If MOD04 is selected, then δt = ±30 minutes
If AERONET is selected, then δt = ±30 minutes
If MYD04 is selected, then δt = ±150 minutes
3. MOD04 is the reference
If AERONET is selected, then δt = ±30 minutes
If MISR is selected, then δt = ±30 minutes
If MYD04 is selected, then δt = ±150 minutes
4. MYD04 is the reference
If AERONET is selected, then δt = ±30 minutes
If MISR is selected, then δt = ±150 minutes
If MOD04 is selected, then δt = ±150 minutes
Note: The Scatter Plot may have less data points compared to Time Series Plot because it requires additional time matchup with respect to the reference measurement.
AeroStat Giovanni provides a sequential satellite gridded Level-3 daily maps data derived from Level 2 products. This Level 3 product is provided on a regular longitude-latitude grid with angular resolution 0.5°. This corresponds to spatial resolution of individual grid cell about 54 km along latitude. Spatial resolution along longitude decreases as cosine of latitude. Basically, it is 54 km at the equator and 14 km at the 60° in latitude.
Each cell of the lat-lon grid is produced by averaging all points of Level 2 data that belong to its range of longitudes, latitudes and time epochs and pass the filters specified by the user. The time range of a given cell depends on the calendar date and on longitude. The reported epoch of the map corresponds to the start time of the western border of the map.
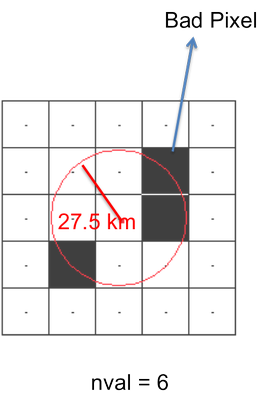
The AeroStat Giovanni provides filters service/function based on no.of pixels, quality assurance (QA) flags, and bias adjustment options, using either criteria recommended by the science team or the users' own criteria. It generates output files that have the same structure as the input (albeit with a few extra variables) and is thus usable in any tool made to work with the original product.
For example, we use 27.5 km radius centered at Satellite pixel as our sample space closest to the AERONET station, in the MAPSS Data (the red circle below). The total number of pixels in the sample space is 9, however, there are 3 bad (invalid) pixels in the sample space. In this case, the "No. of Pixels" (nval) is 6.
In MAPSS data, this QA represents the "mode of QA flags" in the sample space.
In Satellite Only data, we have decoded the original bit mask flags and reported as plain numbers.
In AeroStat Giovanni, we provide preset values for QA filtering option, and the default setting is following science teams recommendations.
| Giovanni Product | QA Preset Values |
Default Setting (Science Team Recommendation) |
|
MODIS Terra/Aqua Dark Target Ocean (470 nm, 550 nm, 660 nm, 870 nm, 1200 nm, 1600 nm, 2100 nm) |
|
QA >= 1 (i.e., QAC=1, 2, 3) |
|
MODIS Terra/Aqua Dark Target Land (470 nm, 550 nm, 660 nm) |
|
QA = 3 |
|
MODIS Terra/Aqua Deep Blue Land at 550 nm |
|
QA = 3 |
|
MISR AOD (446 nm, 558 nm, 672 nm, 866 nm) |
|
QA < = 1 (i.e., QAC = 0, 1) |
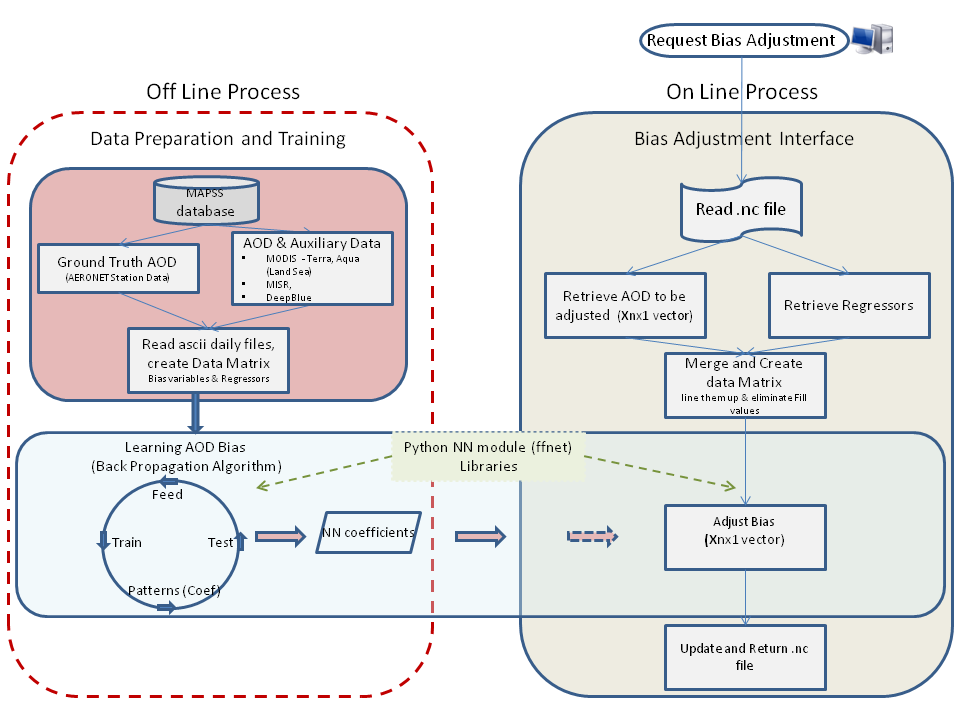
Machine-learning approach (currently, Neural Networks (NN)) is used to persistently adjust bias between aerosol optical depth (AOD) from MODIS Terra, MODIS Aqua, MISR, and the ground-base AERONET. We have seven training data sets, MODIS Terra Land, MODIS Terra Ocean, MODIS Terra Deep Blue over Land, MODIS Aqua Land, MODIS Aqua Ocean, MODIS Aqua Deep Blue over Land, and MISR. Since Neural Networks (NN) are multivariate non-parametric "learning" algorithms, it is better to include variables that may contain related information about the retrieved AOD during the training process as well as applying the bias adjustment process. We refer these additional information as "Regressors". The processing diagram/flowchart is shown in the following figure.
Figure: Flowchart of Neural Networks Bias Adjustment in AeroStat
The seven regressor lists are described in the following:
1. Regressors for MODIS Terra Land for adjusting AOD at 550 nm
There are 14 additional variables (regressors)
| Solar Zenith Angle | Solar Azimuth Angle | Sensor Zenith Angle |
| Sensor Azimuth Angle | Scattering Angle | Land AOD 470 nm |
| Land AOD 660 nm | Land Reflectance 550 nm | Land Reflectance 470 nm |
| Land Reflectance 660 nm | Standard Deviation in Reflectance 470 nm | Standard Deviation in Reflectance 2100 nm |
| Cloud Fraction over Land | QA over Land |
| Solar Zenith Angle | Solar Azimuth Angle | Sensor Zenith Angle |
| Sensor Azimuth Angle | Scattering Angle | Ocean AOD 470 nm |
| Ocean AOD 660 nm | Ocean AOD 870 nm | Ocean Reflectance 550 nm |
| Ocean Reflectance 470 nm | Ocean Reflectance 660 nm | Cloud Fraction over Ocean |
| QA over Ocean |
| Solar Zenith Angle | Solar Azimuth Angle | Sensor Zenith Angle |
| Sensor Azimuth Angle | Scattering Angle | Ocean AOD 470 nm |
| Ocean AOD 660 nm | Ocean AOD 870 nm | Ocean Reflectance 550 nm |
| Ocean Reflectance 470 nm | Ocean Reflectance 660 nm | Cloud Fraction over Ocean |
| QA over Ocean |
| Solar Zenith Angle | Solar Azimuth Angle | Sensor Zenith Angle |
| Sensor Azimuth Angle | Scattering Angle | Deep Blue Land AOD 412 nm |
| Deep Blue Land AOD 470 nm | Deep Blue Land AOD 660 nm | Deep Blue Land Reflectance 412 nm |
| Deep Blue Land Reflectance 470 nm | Deep Blue Land Reflectance 660 nm | Standard Deviation in Reflectance 412 nm |
| Standard Deviation in Reflectance 470 nm | Standard Deviation in Reflectance 660 nm | Cloud Fraction over Land |
| QA over Land |
|
Solar Zenith Angle |
Glitter Angle1 |
Glitter Angle2 |
|
Glitter Angle3 |
Glitter Angle4 |
Glitter Angle5 |
|
Glitter Angle6 |
Best Estimate AOD 446 nm |
Best Estimate AOD 672 nm |
|
Best Estimate AOD 866 nm |
Best Estimate Single Scattering Albedo 558 nm |
Best Estimate Single Scatter Albedo 446 nm |
|
Best Estimate Single Scatter Albedo 672 nm |
Best Estimate Single Scatter Albedo 866 nm |
Best Estimate AOD fraction for small particles 558 nm |
|
Best Estimate AOD fraction for large particles 558 nm |
Best Estimate AOD fraction for spherical particles 558 nm |
Best Estimate AOD fraction for non-spherical particles 558 nm |
|
Best Estimate AOD fraction for medium particles 558 nm |
Number of successful mixtures |
QA for best estimate AOD |
Are the AERONET AOD L2 in AeroStat the same as original AERONET AOD L2 data?
No. AeroStat is using MAPSS dataset, which has aggregated AERONET AOD L2 within a temporal and spatial domain. Please see the details.
Why do I see different data points between Time Series and Scatter Plot?
Time Series should have more data points than Scatter Plot, because Scatter Plot has done further "filtering" or "Matching" pairs according to the user selected reference measurement.
|
|
NASA Privacy Policy and Important Notices Last updated: May 02, 2013 12:41 PM ET |
|